
1. The Eli Lilly & Mounjaro Disruption: A New Market Era
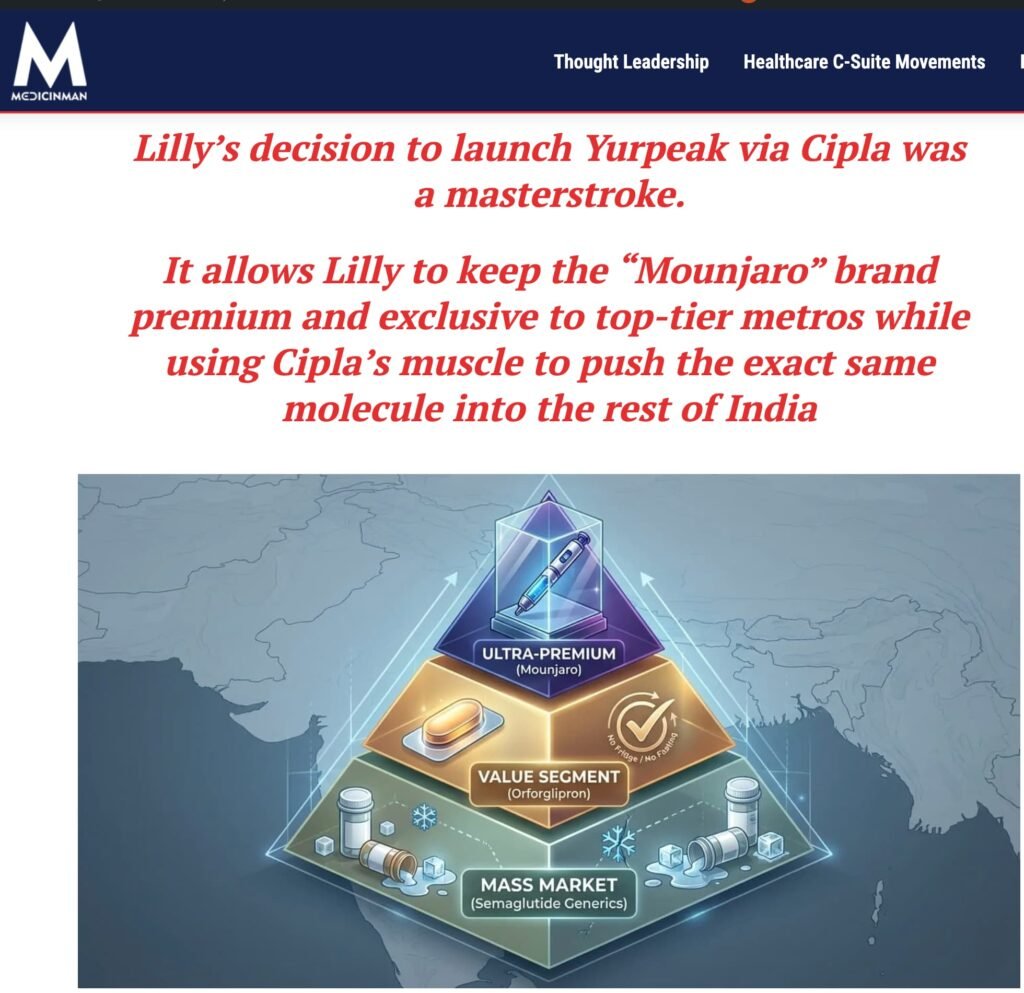
The defining narrative of the Indian Pharmaceutical Market (IPM) in May 2026 centers on Eli Lilly and its breakthrough metabolic formulation, MOUNJARO. Following significant shifts in the incretin market—including the patent expiry of generic semaglutide in March 2026—Eli Lilly has successfully capitalized on an unprecedented wave of physician and patient demand for advanced dual GIP/GLP-1 therapies optimized for glycemic control and obesity management.
This strategic introduction has completely disrupted traditional market hierarchies:
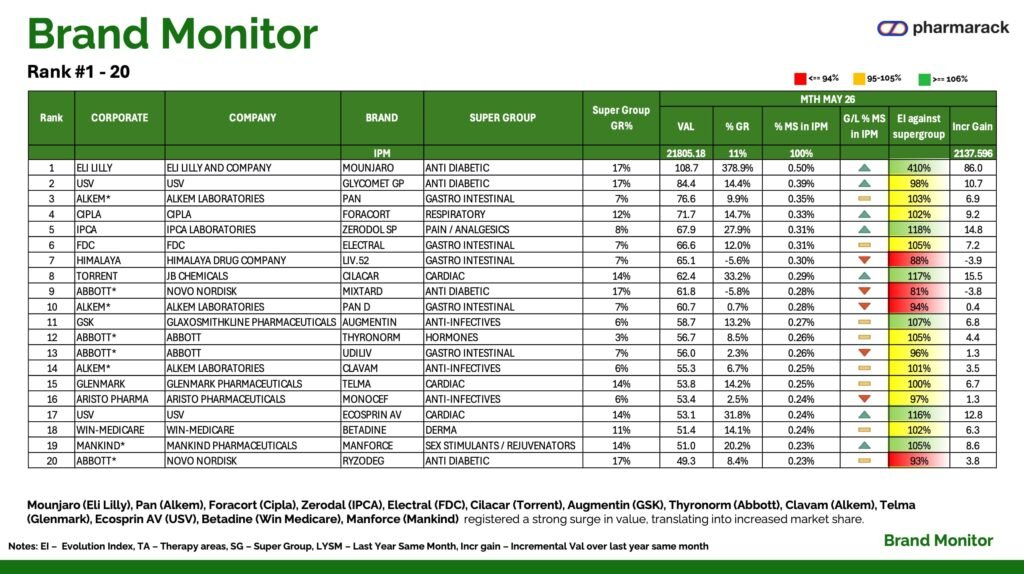
- Explosive Brand Growth: MOUNJARO has rocketed to the #1 individual brand position by value in the entire IPM, generating a calculated absolute value of 104.66 (reported as 105.2 to account for rounding adjustments)*.
- Hyper-Acceleration Metrics: The brand registered an extraordinary year-on-year growth rate of 378.9%. It swept the monthly performance awards, ranking as the top brand nationwide for Incremental Value Gain (86.0), Market Share Gain, and the Highest Evolution Index (EI) against its supergroup.
- Corporate Transformation: Propelled almost entirely by this single molecule’s rapid onboarding, Eli Lilly (Rank 30) registered a staggering corporate growth rate of 198.2%, achieving a dominant corporate Evolution Index of 269%.
Can Eli Lilly Outrun the Same-Glutide Stampede with Tirzepatide and Orforglipron? https://medicinman.net/2026/04/can-eli-lilly-outrun-the-same-glutide-stampede-with-tirzepatide-and-orforglipron/
                     MOUNJARO PERFORMANCE AT A GLANCE
┌──────────────────────────────┬──────────────────────────────┬──────────────────────────────┐
│       BRAND VALUE (VAL)      │     YEAR-ON-YEAR GROWTH      │    EVOLUTION INDEX (EI)      │
│           105.2*             │           378.9%             │            410%              │
└──────────────────────────────┴──────────────────────────────┴──────────────────────────────┘
*Footnote: The primary source document lists this value as 2105.18 on page 17, which is a clear mathematical typo as it would conflict with total IPM parameters. The value has been corrected to 105.2 here, derived directly from its audited, explicit 0.48% Market Share (MS) of the total 21,805.18 IPM value.
2. IPM Outlook & Super Group Audit
The overall IPM exhibited solid structural strength, recording an aggregate valuation of 21,805.18 and expanding at a steady year-on-year growth rate of 10.9%.
The table below reflects the exact structural parameters and headers utilized by the primary audit on page 4, validating that the momentum remains heavily anchored by chronic therapeutic categories.
Super Group Metrics (MTH MAY 26)
| SUPER GROUP | VAL | % Gr | % Contri | EI | Incr Gain |
| IPM | 21,805.18 | 10.9% | — | 100% | 2,137.596 |
| CARDIAC | 3,184.20 | 13.9% | 14.60% | 103% | 389.10 |
| GASTRO INTESTINAL | 2,680.30 | 6.7% | 12.29% | 96% | 169.00 |
| ANTI-INFECTIVES | 2,220.80 | 6.1% | 10.18% | 96% | 126.80 |
| ANTI DIABETIC | 2,151.50 | 16.8% | 9.87% | 105% | 309.80 |
| VITAMINS/MINERALS/NUTRIENTS | 2,024.20 | 12.5% | 9.28% | 101% | 224.30 |
| PAIN/ANALGESICS | 1,496.40 | 8.4% | 6.86% | 98% | 116.30 |
| NEURO/CNS | 1,488.10 | 11.0% | 6.82% | 100% | 147.10 |
| RESPIRATORY | 1,410.50 | 12.3% | 6.47% | 101% | 154.30 |
| DERMA | 1,403.80 | 11.3% | 6.44% | 100% | 142.80 |
Super Group Contextual Notes:
- VAL: Absolute Value in INR Crores.
- EI (Evolution Index): Indication of relative growth performance against the baseline market; an EI $> 100\%$ implies outperforming market evolution.
- Incr Gain: Incremental Value gained over Last Year Same Month (LYSM).
- Growth Outliers: Vaccines led all minor segments in velocity with a 17.6% growth rate, while Anti-Malarials pulled back by -4.5%.
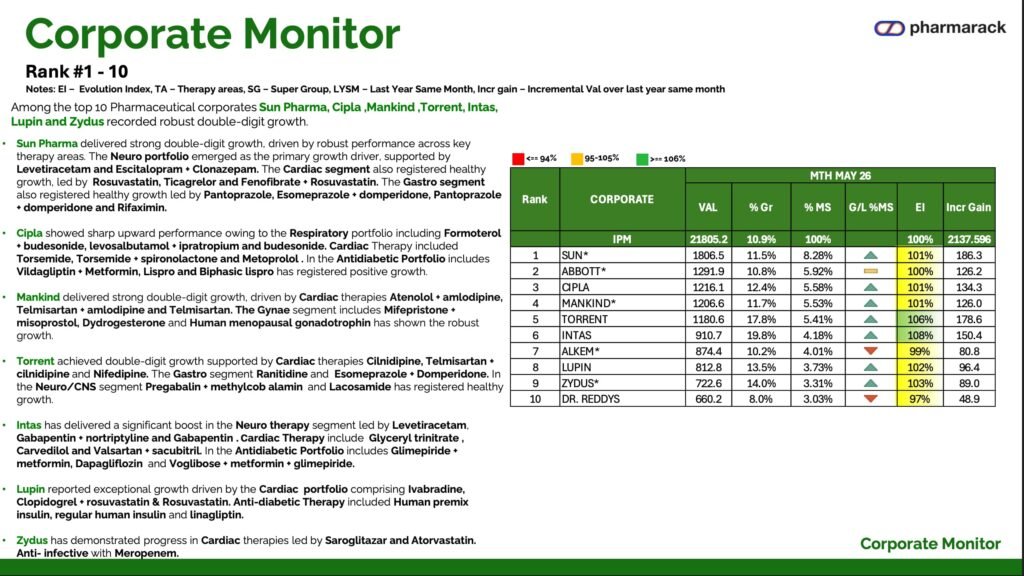
3. Corporate Landscape Analysis (Ranks 1–10)
Domestic manufacturers continue to hold the highest absolute market shares, anchored by comprehensive portfolios across both acute and chronic therapies.
- SUN PHARMA (VAL: 1,806.50 | +11.5% | % MS: 8.28%): Remained the clear market leader, gaining market share ($\black upward$) powered by its Neuro line (Levetiracetam) and strong Cardiac presence (Rosuvastatin).
- ABBOTT (VAL: 1,291.90 | +10.8% | % MS: 5.92%): Sustained neutral market share stability ($\blackminus$) across its metabolic and nutritional therapies.
- CIPLA (VAL: 1,216.10 | +12.4% | % MS: 5.58%): Expanded market share ($\black upward$) via its core Respiratory segment (Formoterol + budesonide).
- MANKIND (VAL: 1,206.60 | +11.7% | % MS: 5.53%): Expanded market share ($\black upward$) driven by steady demand for Cardiac combinations (Telmisartan) and its Gynae franchise.
- TORRENT (VAL: 1,180.60 | +17.8% | % MS: 5.41%): Significantly outpaced the top-5 average growth velocity, marking an EI of 106%.
- INTAS (VAL: 910.70 | +19.8% | % MS: 4.18%): Captured the fastest overall growth inside the elite Top 10 tier, logging an EI of 108%.
- ALKEM (VAL: 874.40 | +10.2% | % MS: 4.01%)
- LUPIN (VAL: 812.80 | +13.5% | % MS: 3.73%)
- ZYDUS (VAL: 722.60 | +14.0% | % MS: 3.31%)
- DR. REDDYS (VAL: 660.20 | +8.0% | % MS: 3.03%)
Mounjaro Shows Heart-Health Benefits in Major Diabetes Study https://medicinman.net/2025/08/mounjaro-shows-heart-health-benefits-in-major-diabetes-study/
4. Brand Performance Highlights
The brand tracking grid below identifies key volume and value anchors across the leading 100 brands, with a focus on notable value performance accelerators.
Selected Brand Highlights (MTH MAY 26)
| Rank | BRAND | CORPORATE | SUPER GROUP | VAL | % GR | EI Against Supergroup | Incr Gain |
| 1 | MOUNJARO | ELI LILLY | ANTI DIABETIC | 105.20* | 378.9% | 410% | 86.0 |
| 2 | GLYCOMET GP | USV | ANTI DIABETIC | 84.40 | 14.4% | 98% | 10.7 |
| 3 | PAN | ALKEM | GASTRO INTESTINAL | 76.60 | 9.9% | 103% | 6.9 |
| 4 | FORACORT | CIPLA | RESPIRATORY | 71.70 | 14.7% | 102% | 9.2 |
| 5 | ZERODOL SP | IPCA | PAIN/ANALGESICS | 67.90 | 27.9% | 118% | 14.8 |
| 8 | CILACAR | TORRENT | CARDIAC | 62.40 | 33.2% | 117% | 15.5 |
| 34 | TELMA AM | GLENMARK | CARDIAC | 38.10 | 35.4% | 119% | 10.0 |
| 88 | LIMCEE | ABBOTT | VITAMINS/MINERALS/NUTRIENTS | 24.20 | 57.9% | 140% | 8.9 |
LEGEND FOR MARKET SHARE TREND SYMBOLS (G/L %MS Column Context)
▲ = Sharp increase / Gain in Market Share over Last Year Same Month
▼ = De-growth / Loss in Market Share over Last Year Same Month
- = Stable / Flat Market Share position year-on-year
Key Brand Summary Notes
- GLYCOMET GP (USV): Retains its status as an exceptionally robust chronic volume anchor in the Anti-Diabetic category, pulling in 84.40 in absolute value[cite: 1].
- ZERODOL SP (IPCA): Demonstrated remarkable therapeutic dominance in Pain Management, capturing 27.9% growth and an Evolution Index of 118% against its baseline supergroup[cite: 1].
- LIMCEE (Abbott): Significantly outpaced standard preventative wellness trends, recording a sharp 57.9% value spike and an EI of 140%[cite: 1].
Data Framework Source: Pharma Monitor May’26


