Every month, MedicinMan in partnership with IMS Health, brings our readers the latest industry numbers related to sales and revenues of the top companies, brands and therapy areas in the Indian Pharmaceutical Market.
The Indian Pharmaceutical Market (IPM) was valued at Rs. 10,278 crs in the month of September 2016 clocking a strong 10% growth over same period last year (SPLY). On a MAT September basis, the industry was valued at Rs. 111,022 crores and reflected a 13% growth with volumes contributing around 40% of this growth and New Introductions playing an important role with around 38% contribution to the overall growth.The Indian Pharmaceutical Market (IPM) was valued at Rs. 10,278 crs in the month of September 2016 clocking a strong 10% growth over same period last year (SPLY). On a MAT September basis, the industry was valued at Rs. 111,022 crores and reflected a 13% growth with volumes contributing around 40% of this growth and New Introductions playing an important role with around 38% contribution to the overall growth.
The retail channel remained the largest channel in IPM contributing 84% of the overall sales and reflected a 13% growth. The hospital and doctor channel contributed to 10% & 6% of the overall sales and reflected a 17% & 15% growth respectively on a MAT September basis.
The retail channel remained the largest channel in IPM contributing 84% of the overall sales and reflected a 13% growth. The hospital and doctor channel contributed to 10% & 6% of the overall sales and reflected a 17% & 15% growth respectively on a MAT September basis. It is expected that the hospital channel will continue to report robust growth rates due to rapid capacity expansion in this space. As per IMS data which captures sales from trade stockists, more than 10 TAs in the IPM have already crossed a sale of Rs. 500 crores in the hospital segment viz. Anti Infectives, Cardiac, Gastrointestinals, Pain, Neuro, VMN, Gynae, Anti-diabetics, Vaccines & Respiratory.
IPM continued to remain fragmented with top 10 companies occupying 43% of the share and top 20 companies reflecting strong double digit growth for the month. Companies 31-40 collectively reflected a single digit growth on account of Himalaya (9%), Unique Pharma (9%) and Astra Zeneca (3%) which reflected a low growth.
Seven out of the top 10 companies reflected a double digit growth with Sun Pharma (11%), Cipla (11%), Alkem (16%), Macleods (18%), Lupin (15%) outpacing the market
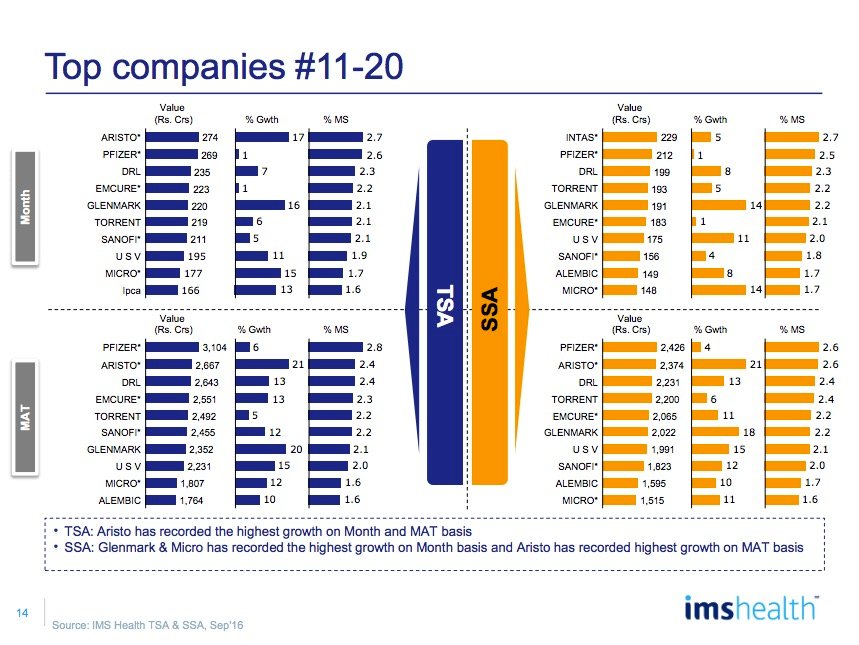
Seven out of the top 10 companies reflected a double digit growth with Sun Pharma (11%), Cipla (11%), Alkem (16%), Macleods (18%), Lupin (15%) outpacing the market for the month while among the 11-20 companies, Aristo (17%), Glenmark (16%), USV (11%), Micro (15%) & IPCA (13%) grew faster than the market.
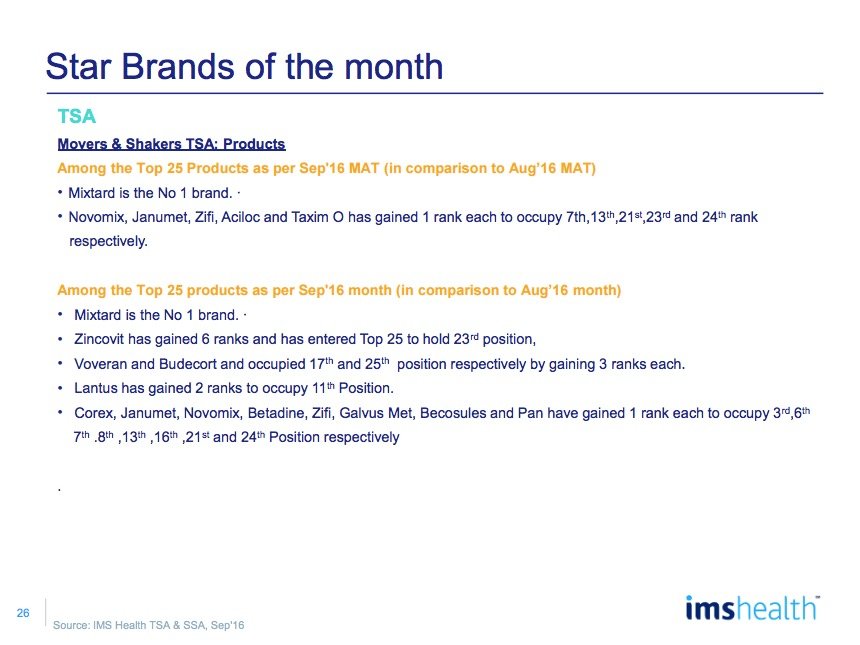
Among top 25 companies, Sun Pharma maintained its top position in the IPM with a market share of 7.84% and 11.4% growth, Intas gained 2 ranks and moved to 10th rank for the Month while Zydus and Novartis* gained 1 rank each and moved to 8th & 15th rank respectively vis-à-vis August 2016.
Domestic companies continued to dominate the market with a 79% share in Sep’16 with a growth of 11%. MNCs on the other hand reflected a growth of 6.5% for the month, after reaching a six month high growth of 12.5% in August.
Domestic companies continued to dominate the market with a 79% share in Sep’16 with a growth of 11%. MNCs on the other hand reflected a growth of 6.5% for the month, after reaching a six month high growth of 12.5% in August. Large MNCs like Abbott, GSK and Pfizer which contributed almost 57% of the total MNC share in the month reflected growths of 10%, 3% and 1% respectively.
Acute therapies remained the strongest pillar of IPM with a 66% contribution to the total market. After reaching a 12 month high of 20% growth in August 2016, acute TAs reflected a slowdown with a 9.5% growth for the month of Sep 2016. Chronic TAs on the other hand outpaced acute TAs reflecting a growth of 11% for the month.
AI was by far the largest TA for the month with a revenue of Rs. 1542 crores reflecting a 10% growth on the back of a good monsoon witnessed across the country. This was an impressive performance considering 14% of the portfolio impacted by the FDC ban
AI was by far the largest TA for the month with a revenue of Rs. 1542 crores reflecting a 10% growth on the back of a good monsoon witnessed across the country. This was an impressive performance considering 14% of the portfolio impacted by the FDC ban comprised of anti-infectives while it was also one of the largest TAs to be affected by the NLEM notification. Top 10 anti-infective molecules reflected an average growth of 16% for the month with Amoxyclav liquids, Cefpodoxime, Meropenem & Cefixime + Oflox combination reflecting superlative growth of 25%, 20%, 19% & 17% respectively.
Cardiac TA maintained its no. 2 position in IPM by a whisker beating GI with a value of Rs. 1103 crores for the month of Sep’16 growing at 6%. The TA was driven by Rosuvastatin (11% gwth), Amlodipine+ Telmisartan (13% gwth) and Olmesartan (10% gwth). Telmisartan which recently came under price control reflected a -2% growth for the month.
Gastrointestinals continued to be the 3rd largest TA for the month garnering a revenue of Rs. 1064 crores with a growth of 8%. PPIs and their combination with Domperidone reflected strong double digit growth. Rabeprazole + Domperidone, Pantoprazole + Domperidone and ranitidine were among the fastest growing molecules with a growth of 11%, 10% and 17% respectively. Lactulose reflected a healthy 31% growth for the month clocking a value of Rs. 29 crores.
Respiratory was the 4th largest TA for the month maintaining its rank gain and clocked an 18% growth over SPLY. Cough preparations, Levosalbutamol combinations, Budesonide and Levocetirizine were among the fastest growing categories in the respiratory space reflecting growth of 16%, 95%, 26% and 23% respectively.
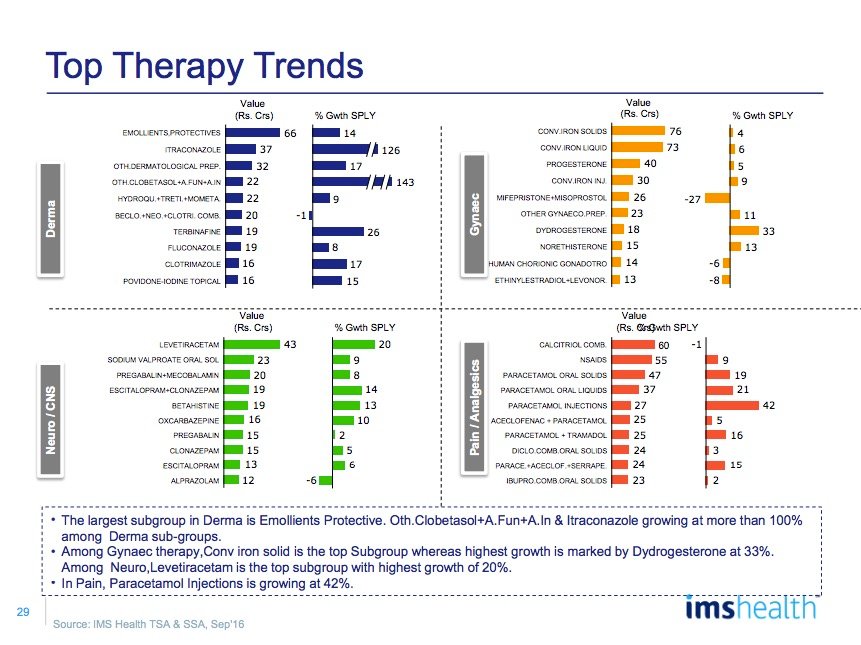
Dermtology was one of the fastest growing TAs for the month registering a growth of 15% SPLY with a value of Rs. 691 crores. Anti- fungals reflected a good pick up during the monsoon season with top molecules like Itraconazole, Terbinafine & Clortimazole growing at 126%, 26% and 17% respectively. Emollients continued to be the largest category within dermatology reflecting a 14% growth for the month.
Among chronic TAs, Anti-Diabetic, Urology & Neurology were among the fast growing TAs, growing at 17% & 11% & 10% for the month respectively. DPP4 inhibitors driven by teneligliptin and the unprecedented number of players it has got into the market and glim+ met formulations spearheaded growth for the AD market. In the neurology space Levetiracetam continued to be the fastest growing molecule in neuro psychiatry for the month clocking a value of Rs. 43 crs with a growth of 20% in Sep 2016. Betahistine & Escitalopram + Clonazepam found place among the fastest growing CNS molecules for the month with a growth of 14% and 13% respectively.
In terms of New Introductions (NI 24 months) which played a crucial role in growth of the IPM, Glenmark had the highest number of NIs (4 Nos.)
In terms of New Introductions (NI 24 months) which played a crucial role in growth of the IPM, Glenmark had the highest number of NIs (4 Nos.) among the top 25 NIs in the industry for the month of Sep’16, followed by Macleods (3 Nos.), J&J, MSD & Hamdard with 2 NIs each featuring among the top 25.
Sr. No 1 PANDERM NM 2 3 201507 5.1 4 ASTRAZENECA 5.0 5 4.7 7 ONE TOUCH SELECT 201501 4.4 4.1 10 4.0 11 3.4 13 SAFI HAMDARD 3.1 15 2.9 17 2.7 19 2.6 21 2.2 2.2 24 2.2 25
BRANDS
PROD_LNCH
COMPANY
Sep 2016 Val (Rs. Crs)
201605
MACLEODS PHARMA
6.2
RYZODEG FLEXTOUCH
201412
ABBOTT
6.2
CARIPILL
MICRO LABS
FORXIGA
201505
IT-MAC
201510
MACLEODS PHARMA
4.9
6
JARDIANCE
201510
BOEHRINGER INGELH.
ASCORIL-D
201503
GLENMARK PHARMA
4.5
8
JOHNSON & JOHNSON
9
VARIPED
201503
MSD PHARMACEUTICA
ZITA-MET PLUS
201509
GLENMARK PHARMA
INSTAKIT
201604
MACLEODS PHARMA
3.8
12
GONAL-F
201509
MERCK LIMITED
INVOKANA
201503
JANSSEN
3.1
14
201506
ONE TOUCH ULTRA
201501
JOHNSON & JOHNSON
3.0
16
SULISENT
201510
U S V
TERBINAFORCE-LITE
201607
MANKIND
2.9
18
ZITA PLUS
201506
GLENMARK PHARMA
AXCER
201510
SUN
2.7
20
AMBRODIL-S PLUS
201608
ARISTO PHARMA
ONDERO
201512
LUPIN LIMITED
2.5
22
ZITEN-M
201509
GLENMARK PHARMA
23
JANUMET XR
201410
MSD PHARMACEUTICA
BGR-34
201510
AIMIL
SUALIN
201506
HAMDARD
2.1
Global Outlook (August 2016)
The global Pharmaceutical market is valued at US $ 957 Billion growing at 1%. USA, being the market leader with 47% share and growth of 5%.
Amongst the top 15 market, India is ranked 10th and growing at 15% for the month of August and 7% in the MAT year ending Aug 2016.
Table 1: Pharma Market Size in Mn $ USD by Country
|
All values in Million USD |
Aug Month | Month Growth % | Aug MAT | MAT growth % |
| Global Pharma Mkt | 73043 | 1.2 | 957084 |
3.5 |
|
USA |
34726 | 5.2 | 443724 | 7.8 |
|
JAPAN |
6900 | 22.5 | 79180 |
8.6 |
| CHINA | 6315 | 7.3 | 73986 |
0.4 |
|
GERMANY |
3424 | 13.9 | 40295 | -0.4 |
|
BRAZIL |
1995 | 26.6 | 19158 |
-11.6 |
| UK | 1949 | -5 | 25330 |
0.6 |
|
CANADA |
1696 | 11 | 19143 | -4.5 |
| FRANCE | 1663 | -29.2 | 31928 |
-5.2 |
|
VENEZUELA |
1653 | 57.9 | 15293 | 33.1 |
|
INDIA |
1424 | 15.1 | 15064 |
7 |
| AUSTRALIA | 1244 | 38.6 | 12182 |
7.2 |
|
ITALY |
821 | -56.2 | 27340 | 1.9 |
| SPAIN | 820 | -45 | 20286 |
1 |
Indian companies holds 4.3% share in the global market and growing faster than the global market. The share of Indian companies has grown due to higher demand generation in India on account of rainy season. Amongst the top 5 Indian companies, Lupin is growing at 37% while Cipla at 23% and Sun Pharma at 15% respectively in the month of August.
Table 2: Indian companies Market Size in the Global Market
|
All values in Million USD |
Aug Month | Month Growth % | Aug MAT | MAT growth % |
|
Indian companies market size |
3160 | 11.2 | 36712 |
7.1 |
| SUN PHARMA | 448 | 15 | 5264 |
5.2 |
|
LUPIN |
335 | 37 | 3874 | 20.8 |
|
DR REDDYS LAB |
239 | -4.1 | 3073 | -3 |
|
CIPLA |
177 | 22.7 | 1815 |
8.9 |
| ZYDUS CADILA | 176 | 3.7 |
2052 |
-2.3 |
| TORRENT | 174 | 11.1 | 1939 |
8 |
|
AUROBINDO |
156 | 0.9 | 2269 | 3.9 |
| GLENMARK PHARM | 152 | 11 | 1760 |
5.9 |
|
INTAS |
122 | -8 | 1745 | 13.7 |
|
ALKEM |
110 | 23.5 | 1103 |
11.8 |
| MANKIND PHARMA | 107 | 17.4 | 1115 |
13.9 |
|
MACLEODS PHARMA |
97 | 27.2 | 999 |
10.7 |
IPM Snapshot
TSA = Total Sales Audit which includes Hospital, doctor and retail channels
SSA = Secondary Sales Audit which is retail channel sales from the local pharmacy retailers
