Every month, MedicinMan in partnership with IMS Health, brings our readers the latest industry numbers related to sales and revenues of the top companies, brands and therapy areas in the Indian Pharmaceutical Market.
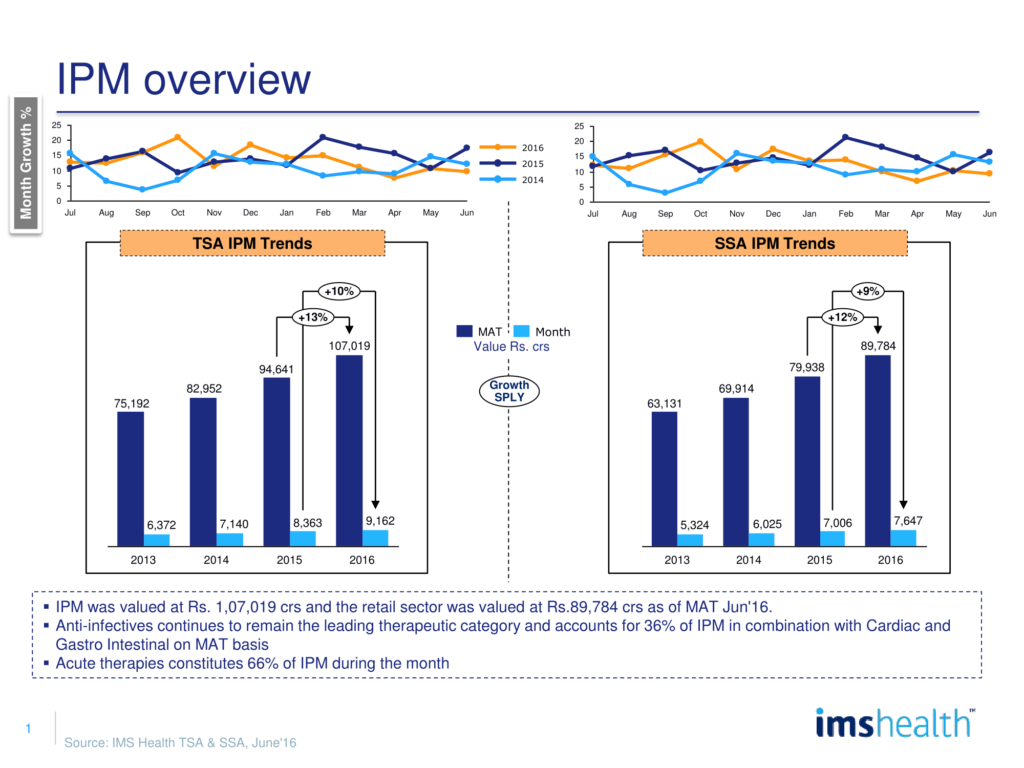
The Indian Pharmaceutical Market (IPM) was valued at Rs. 9162 crores in the month of June 2016 clocking a 9.6% growth over same period last year (SPLY). This is seen revival on track after a dip in growth observed in earlier months of 2016 post the ban imposed on 344 FDCs by the Government of India which affected the buying patterns in the market. On a MAT June basis, the industry was valued at Rs. 107,019 crores and reflected a 13% growth.
The retail channel is the largest channel in IPM contributing 84% of the overall sales and reflects a 9% growth. The hospital and doctor channel contributed to 16% of the overall sales and reflected a growth of 17% on a MAT June basis. It is expected that the hospital channel will continue to report robust growth rates due to rapid capacity expansion in this space.
The retail channel is the largest channel in IPM contributing 84% of the overall sales and reflects a 9% growth. The hospital and doctor channel contributed to 16% of the overall sales and reflected a growth of 17% on a MAT June basis. It is expected that the hospital channel will continue to report robust growth rates due to rapid capacity expansion in this space.
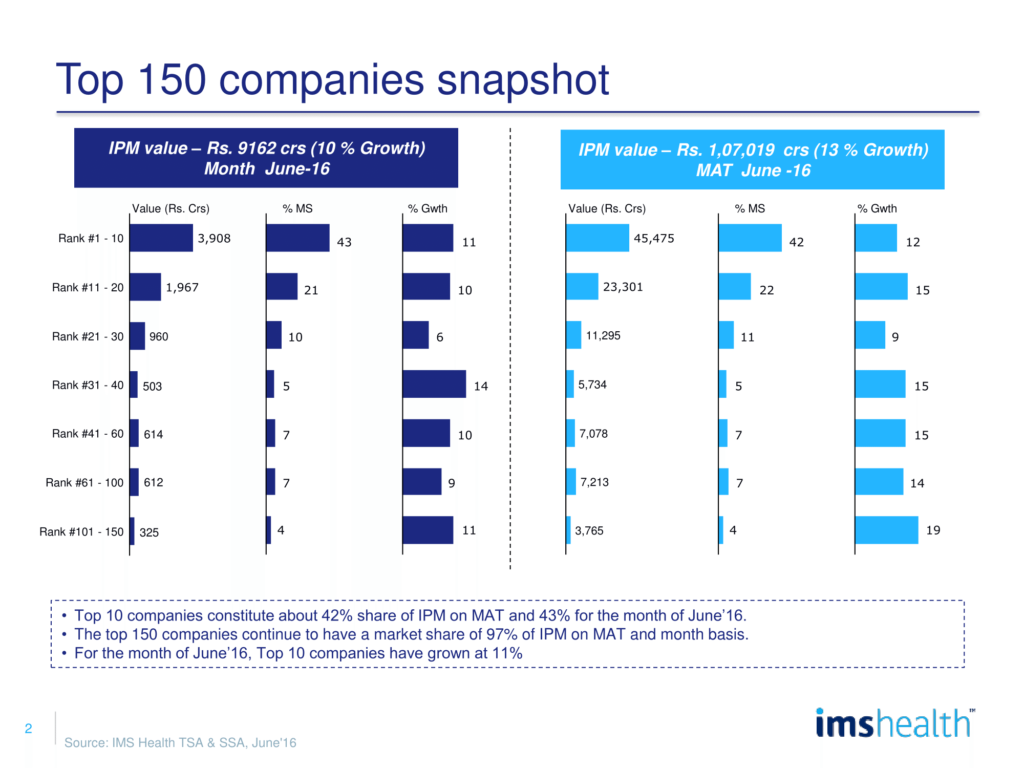
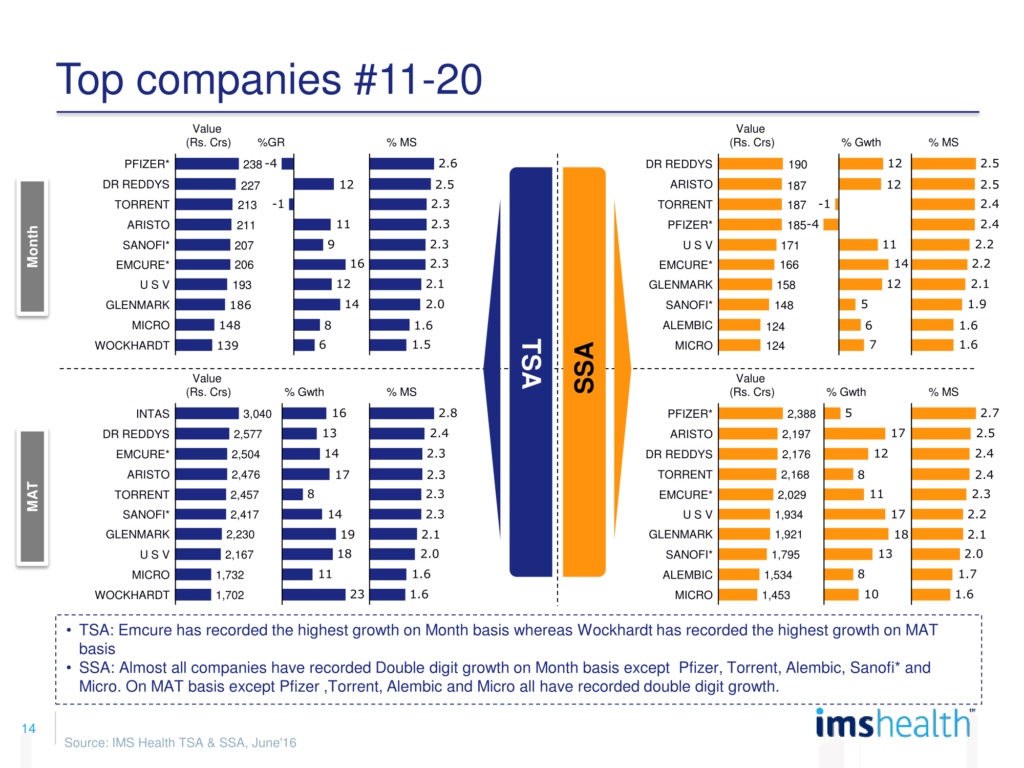
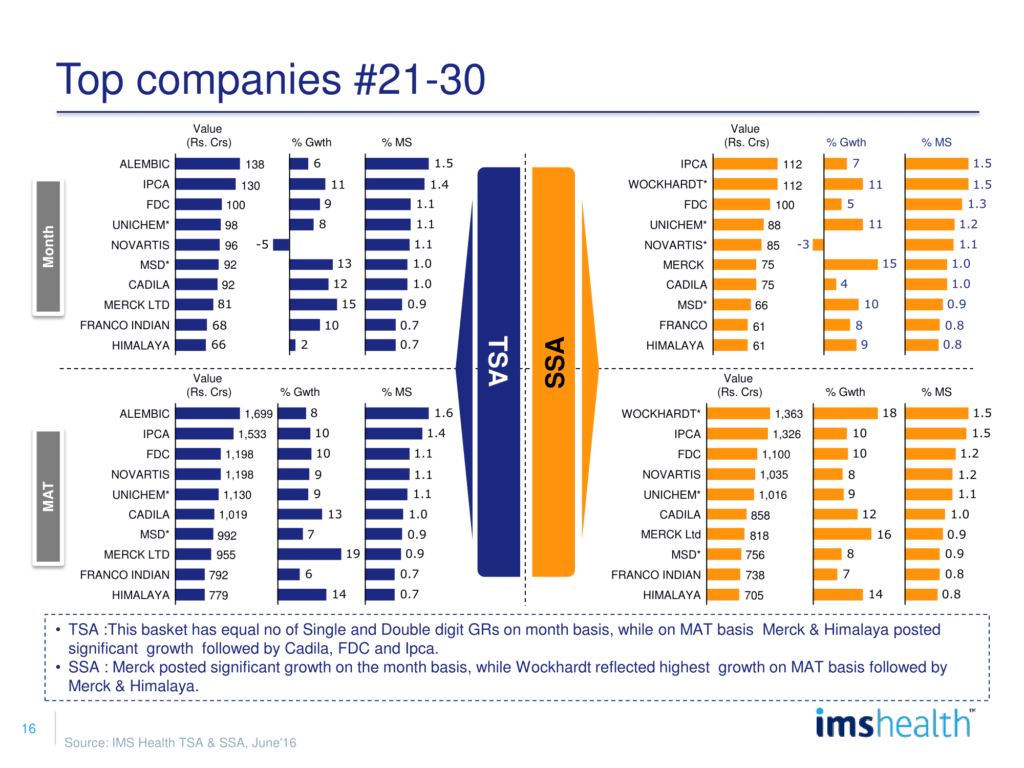
IPM has witnessed some big ticket M&As over the past few years. Despite this consolidation, the industry remains fragmented with top 10 players contributing 43% of overall sales and reflecting a robust 11% growth for the month of June 2016. Companies ranked 11-20 contributed 21% of total revenues for the month reflecting a growth of 10% aided by strong growth posted by Wockhardt (23%), Glenmark (19%), USV (18%), Aristo (17%) and Intas (16%).
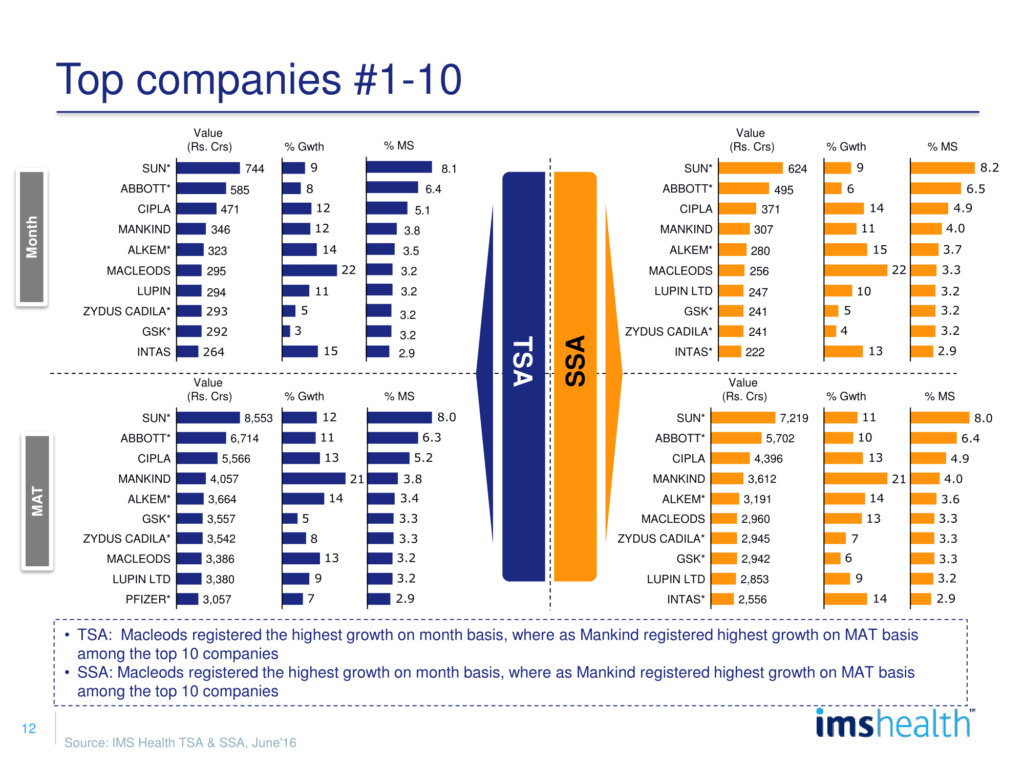
Among top 10 companies, Cipla, Mankind, Alkema, Macleods, Lupin & Intas have registered a growth higher than IPM while among 11-20 companies, DRL, Aristo, Emcure, USV, Glenmark reflect a growth lower than IPM for the month.
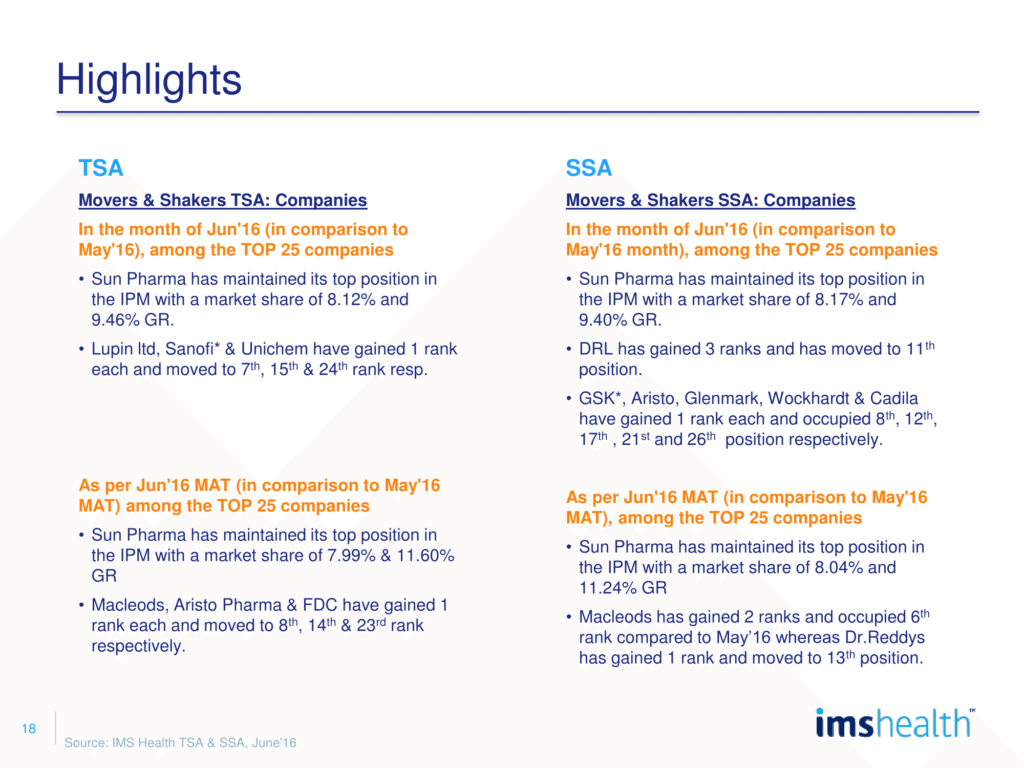
Among top 25 companies, Lupin, Sanofi & Unichem have gained 1 rank each and moved to 7th, 15th & 24th rank respectively in comparison to previous month.
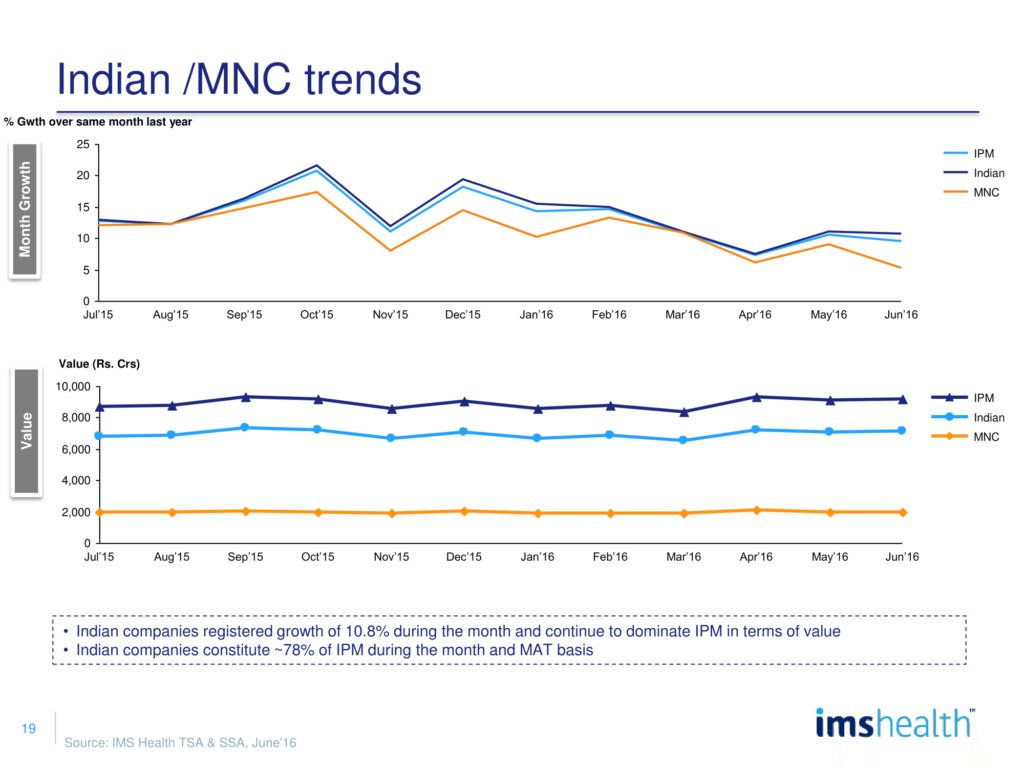
Domestic companies continued to dominate the market with a 78% share in June 2016 with a growth of 10.6%. MNCs reflected a modest growth of 5.3% as large MNCs like Abbott, GSK and Pfizer who contribute to 56% of the total MNC share in the month reflected low growth of 8%, 3% and -4% respectively.
Domestic companies continued to dominate the market with a 78% share in June 2016 with a growth of 10.6%. MNCs reflected a modest growth of 5.3% as large MNCs like Abbott, GSK and Pfizer who contribute to 56% of the total MNC share in the month reflected low growth of 8%, 3% and -4% respectively.
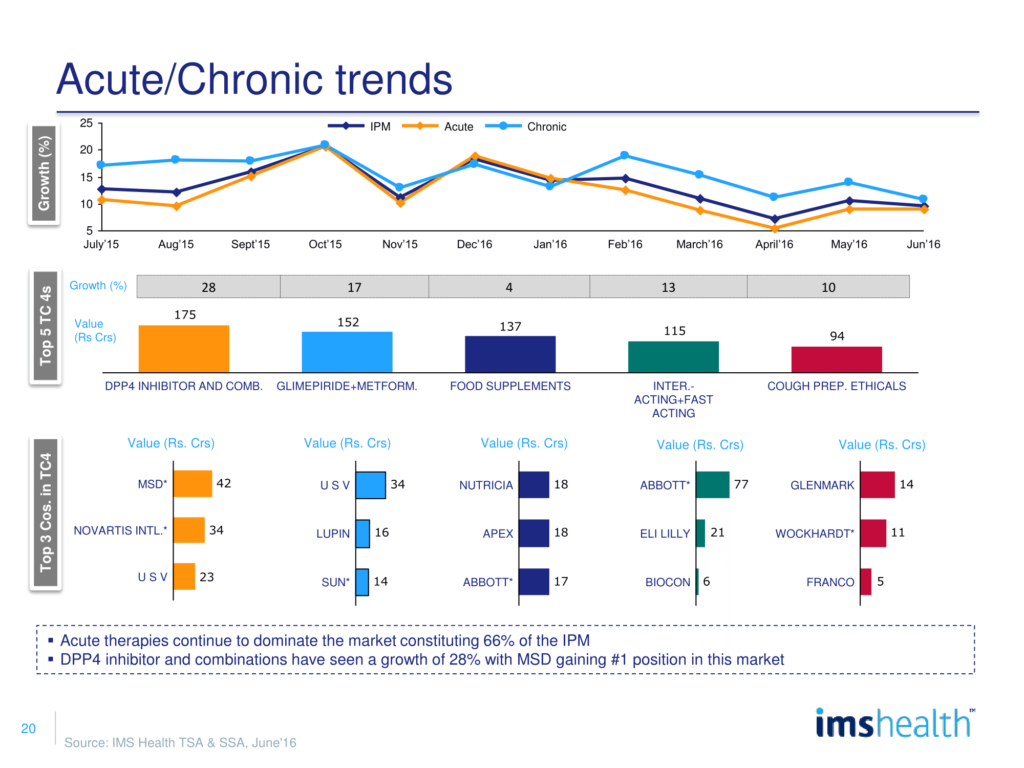
Acute therapies remain the pillar of IPM with a 66% contribution to the total market for the month. Chronic therapy areas have outpaced acute therapies consistently in terms of growth at 10.7% for the month vis-à-vis a 9% growth for acute therapy areas.
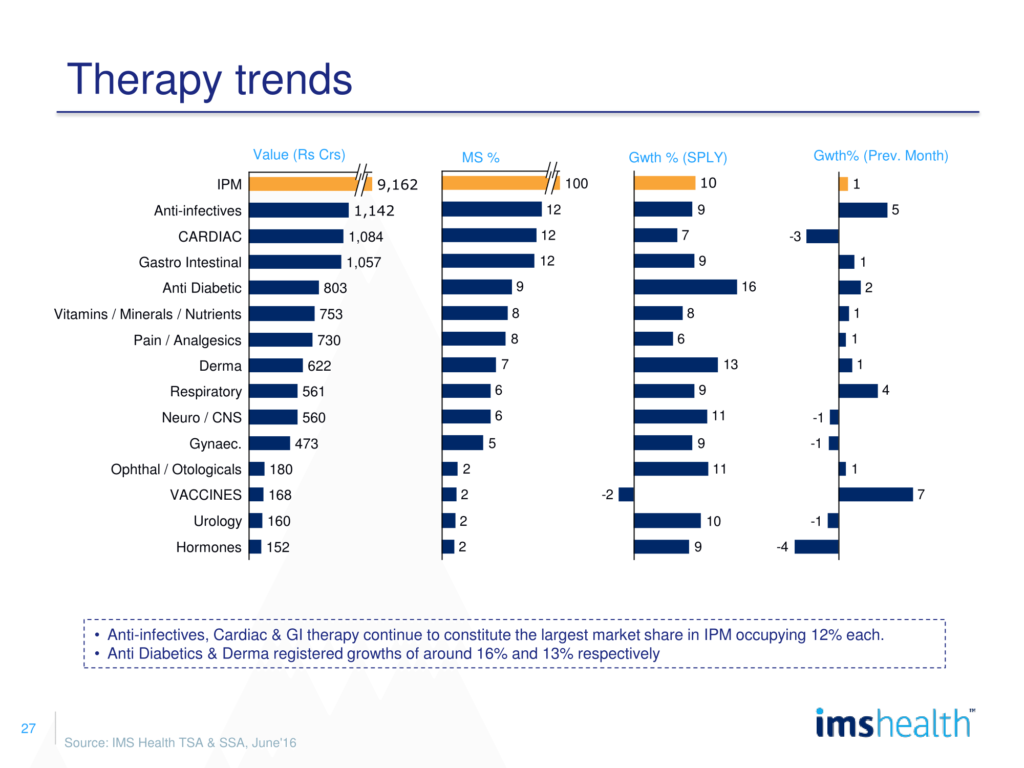
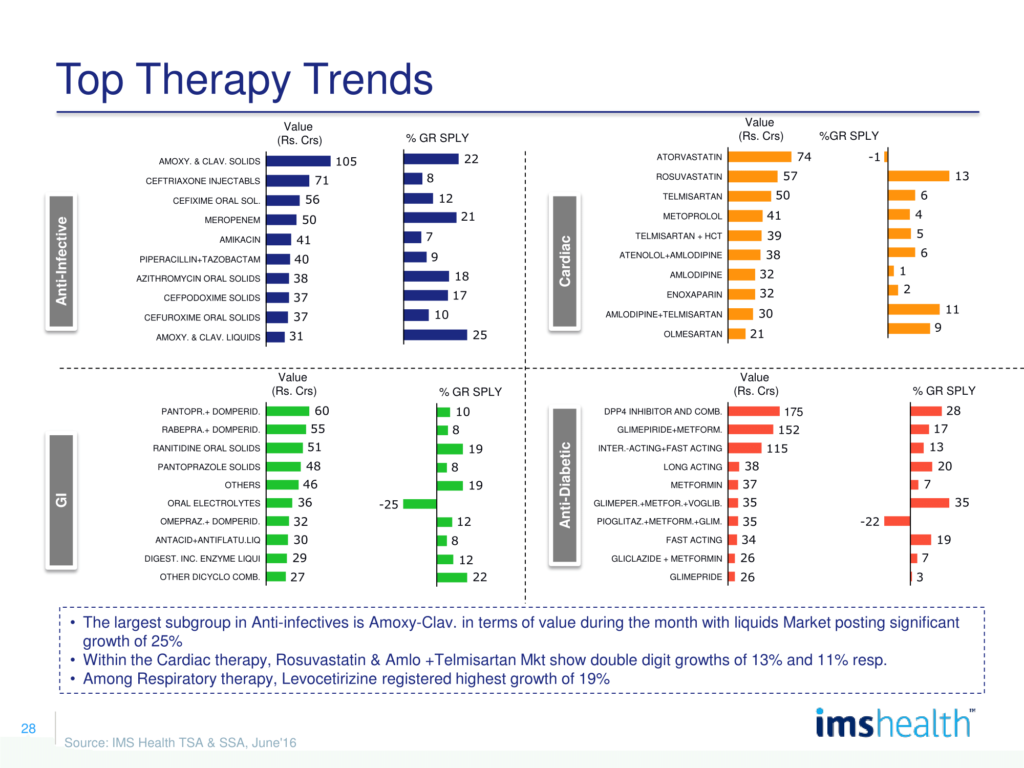
Anti-Infective was the largest Therapy Area (TA) for the month with a revenue of Rs. 1142 crores reflecting a 9% growth vis-à-vis a 4% growth reflected in the month of May on the back of a good monsoon seen by the country. 15% of the AI portfolio was impacted by the FDC ban while it was also one of the largest TAs to be affected by the NLEM notification. Amoxyclav solids & liquids reflected a strong growth of 22% & 25% respectively while Meropenem remained one of the fastest growing molecules with a 21% growth for the month.
Cardiac was the second largest TA for the month of June 2016 clocking a revenue of Rs. 1084 crores growing at 7% driven by Rosuvastatin (13% growth), Amlodipine+ Telmisartan (11% growth), Telmisartan being affected by NLEM reflected a modest growth of 6% for the month while largest statin Atorvastatin reflected a growth of -1%.
Gastrointestinal was the third largest TA in IPM garnering a revenue of Rs. 1057 crores and a growth of 9% for the month. Ranitidine solids had a strong growth of 19% driven by its 300mg SKU for top companies, Domperidone combinations with PPIs like Omeprazole, Pantoprazole and Rabeprazole reflected consistent growth trends with 12%, 10% & 8% growth respectively.
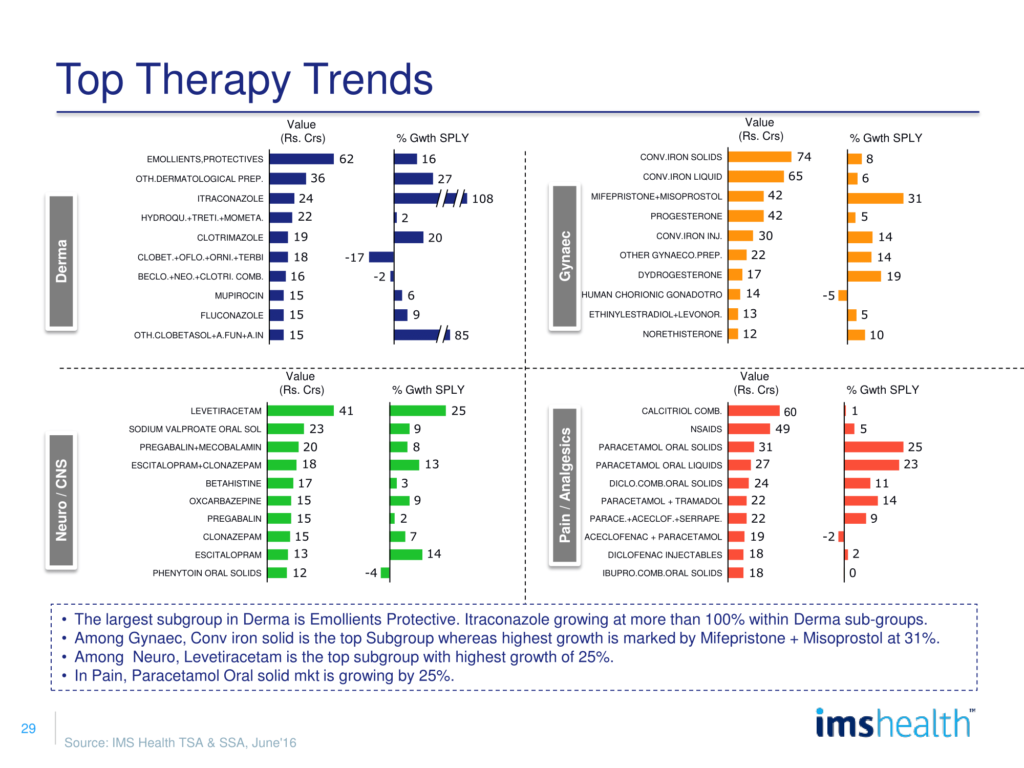
Dermatology continued to reflect robust growth momentum with high NI activity in the Itraconazole space reflecting in a 180% growth for the molecule in the month. Evergreen market of emollients and protectives grew at 16% for the month while Clotrimazole reflected a strong growth of 20% owing to a good monsoon season creating an environment for fungal infections.
Among chronic Therapy Areas (TAs), Anti-Diabetic and Neurology were the fastest growing TAs, growing at 16% & 11% for the month respectively.
Among chronic TAs, Anti-Diabetic and Neurology were the fastest growing TAs, growing at 16% & 11% for the month respectively. DPP4 inhibitors and glim+ met formulations spearheaded growth for the Anti-Diabetic market owing to rising prevalence, diagnostic and treatment rates of diabetes. In the neurology space Levetiracetam was the largest and fastest growing molecule for the month clocking a value of Rs. 40 crores with a growth of 25% in June 2016. Escitalopram plain & its combination with Clonazepam found place among the fastest growing Central Nervous System (CNS) molecules for the month with a growth of 14% and 13% respectively.
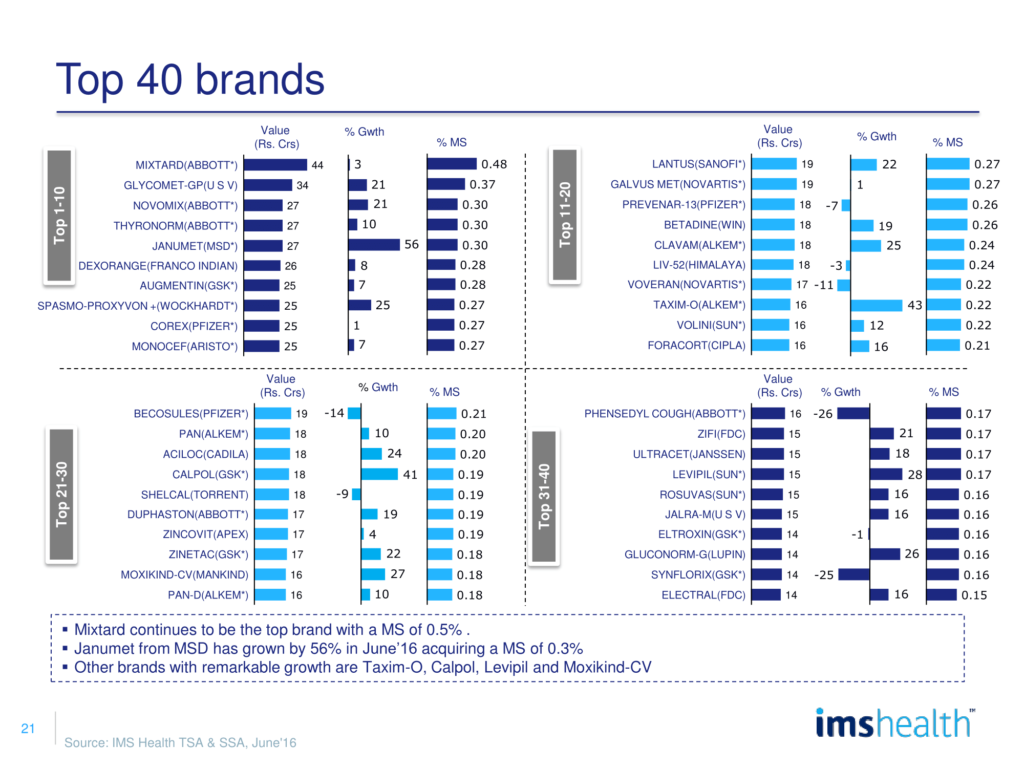
With regulatory environment and new launch approvals getting more stringent over time, companies have focused on brand building. Top companies have driven higher growth with large brands with only Zydus, Sanofi, and Pfizer reflecting single digit growth/de-growth for their portfolio which falls under the top 300 brands in the month of June 2016.
| Company | No. of Brands in Top 300 Month June | Value. of Brands in Top 300 Month June (Rs. Crores) | Growth | ||
| 2015 | 2016 | 2015 | 2016 | ||
| SUN | 27 | 29 | 206 | 257 | 25% |
| ABBOTT | 27 | 28 | 271 | 301 | 11% |
| CIPLA | 22 | 23 | 155 | 187 | 21% |
| PFIZER | 17 | 16 | 165 | 159 | -4% |
| GLAXOSMITHKLINE | 14 | 15 | 163 | 180 | 10% |
| ALKEM | 14 | 15 | 130 | 155 | 20% |
| ARISTO PHARMA | 10 | 11 | 90 | 105 | 17% |
| SANOFI | 12 | 11 | 101 | 109 | 8% |
| MANKIND | 9 | 11 | 65 | 86 | 31% |
| ZYDUS CADILA | 12 | 11 | 77 | 77 | 0% |
Global Outlook
The global Pharmaceutical market is valued at US $ 943 Bn growing at 2%. USA continues to dominate the market with 47% market share with growth of 10%.
Amongst the top 15 market, India is ranked 11th and growing at 6% in the year ending in May 2016.
Table 1: Pharma Market Size in Mn $ USD by Country
| All values in Mn USD | May 2016 (Month) | Month Growth % | MAT (May 2016 Month) | MAT growth % |
| Global Pharma Mkt | 70702 | -2.4 | 943473 | 2.4 |
| USA | 34960 | 9.3 | 439052 | 9.7 |
| JAPAN | 6117 | 13.2 | 76750 | 2.7 |
| CHINA | 6181 | 5.3 | 74210 | 2.3 |
| GERMANY | 2836 | -6.8 | 39318 | -6.2 |
| FRANCE | 1802 | -27.3 | 31595 | -10.5 |
| ITALY | 1041 | -53.9 | 26783 | -1.1 |
| UK | 2103 | 3.8 | 25973 | 3.9 |
| SPAIN | 924 | -45.4 | 20069 | -0.1 |
| CANADA | 1661 | 1.8 | 19026 | -7.1 |
| BRAZIL | 1740 | -2.5 | 18524 | -19.3 |
| INDIA | 1235 | 5 | 14700 | 6.2 |
| VENEZUELA | 1321 | 33.4 | 13519 | 27 |
| AUSTRALIA | 1146 | 24.7 | 11272 | -4.2 |
Table 2: Indian companies Market Size in the Global Market
| All values in Mn USD | May 2016 (Month) | Month Growth % | MAT (May 2016 Month) | MAT growth % |
| Indian Companies Market Size | 1951 | -1.2 | 24944 | 6.4 |
| SUN PHARMA | 307 | 13.5 | 3558 | -3 |
| LUPIN | 283 | 37.1 | 3054 | 12.5 |
| DR REDDYS LAB | 182 | -14.2 | 2604 | -2.9 |
| AUROBINDO | 131 | -1.6 | 1833 | 3.9 |
| ZYDUS CADILA | 110 | -14.8 | 1548 | 2.6 |
| GLENMARK | 101 | -11 | 1326 | 3.5 |
| INTAS | 76 | -14.1 | 1218 | 11.4 |
| TORRENT | 94 | -1.6 | 1170 | 11.7 |
| CIPLA | 77 | 5.4 | 958 | 7.5 |
| HETERO DRUGS | 45 | -14.1 | 731 | 93.6 |
| ALKEM | 52 | 5.8 | 630 | 12.1 |
| WOCKHARDT | 40 | -18.6 | 576 | -8.4 |
IPM Snapshot
TSA = Total Sales Audit which includes Hospital, doctor and retail channels
SSA = Secondary Sales Audit which is retail channel sales from the local pharmacy retailers
